

If you’ve seen my prior blog posts, you’ll know I’m always on the hunt for the best way to organize, analyze and present data. One of the best professional business websites I have used as a graduate student and in my workplace for strategic planning and evaluation of project development is Statista.com. This site is focused on providing visualizations of data through intelligent infographics. The site is widely known as the best resource for worldwide stats and any major company or industry.
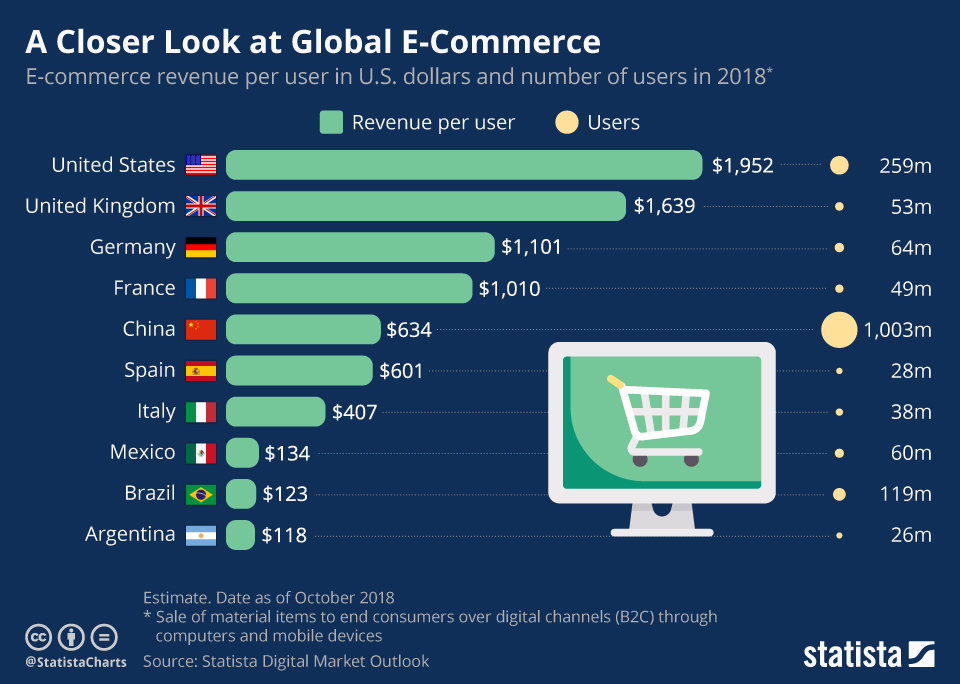
Feldman, S. (November 26, 2018). A Closer Look at Global E-Commerce [Digital image]. Retrieved July 11, 2021, from https://www.statista.com/chart/16215/global-ecommerce-revenue/
The beauty of Statista is that it assembles the data in Excel, graphs the data, and provides a comprehensive report. The entire report is downloadable in PowerPoint, Excel, MS Word, or PDF. It can save hours, days, or even weeks to review a specific company, industry, or topic. The service is highly in tune with major trends and provides comprehensive topical reporting such as with Covid and vaccine news. Its headquarters are in Germany, but they have offices all over the world.
In terms of reporting, as an example, today’s highlighted reports include Coronavirus, Social Media, E-Commerce, Smartphones, China, Cosmetics, Gaming, Film Industry, and the United States. The latest updated infographics and data within each of these topics are provided. The trends are presented in bar graphs, line graphs, pie charts, and innovative dashboards to understand the complete picture. A typical full “dossier” report will provide from 60 pages to 100 pages of data. Information I have downloaded includes data on Facebook, Google, Apple, Tesla, IKEA, Southwest Airlines, etc. The reports are available by industry and will list the top 10 or 20 companies in a particular field. The companies are compared on specific vital statistics so you can quickly understand the market. With Statista, I do believe a picture is worth 1,000 words.
In the video above, I provide some screenshots of example infographics and reporting available. There is also a one and half minute overview of the company by the founder Dr. Friedrich Schwandt.

Excellent post Krist. Organization is not my strength and this is helpful!
LikeLike